Observability Data Model
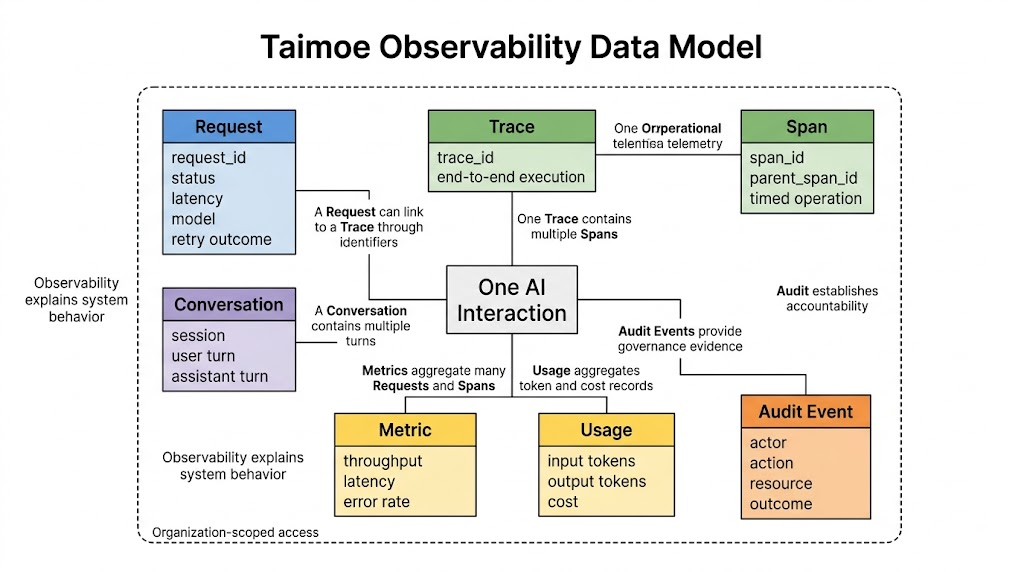
Taimoe exposes several views over related but distinct records. Choosing the right entity avoids treating security evidence, user history, and performance telemetry as interchangeable.
| Entity | Primary question | Typical identifier |
|---|---|---|
| Request | What happened at the Gateway? | request_id |
| Conversation | What did a user and Agent exchange? | conversation/session ID |
| Trace | What was the end-to-end execution? | trace_id |
| Span | What happened in one timed operation? | span_id |
| Metric | How is the system behaving in aggregate? | time bucket + dimensions |
| Usage | How many tokens and how much cost were consumed? | time range + grouping |
| Audit event | Who changed or invoked what? | audit row + request ID |
Requests
A Request is the Gateway-level record of a model call or rejection. It is the best starting point for provider status, latency, model alias, token usage, cost, limit failures, and retry outcome. The response header X-Request-ID links the caller's observation to this record.
Conversations
A Conversation groups user and assistant turns into an interaction history. It answers product and support questions such as what was asked, what was returned, and when. It is not a substitute for a Trace because it does not necessarily expose every tool or model operation.
Traces and spans
A Trace represents one distributed execution. Spans are its timed child operations, such as an Agent step, model call, or tool invocation. Parent/child identifiers reconstruct the call tree and help locate latency or failure inside a multi-step Agent workflow.
The span ingestion endpoint accepts batches immediately and writes telemetry asynchronously. Query views read organization-scoped data from BigQuery; ingestion success therefore means the batch was accepted, not that every downstream analytical query is already consistent.
Metrics and usage
Metrics aggregate latency, throughput, errors, and related measures into time buckets. Usage aggregates token and cost data and can group it by supported dimensions such as Team, Virtual Key, Agent, or Runtime. Some groupings come from Gateway audit rows while others come from spans, so missing correlation fields can appear as unknown rather than being guessed.
Audit events
Audit events are governance evidence. Administrative audit records configuration mutations, while Gateway audit records inference traffic and rejected calls. Observability helps diagnose behavior; audit helps establish accountability. The same request or trace identifiers can connect the two when instrumentation supplies them.
Tenant boundary
Read APIs scope Requests, Conversations, Traces, Metrics, Usage, and Audit Logs to the selected Organization and verify membership or administrative permission. A raw identifier alone is not sufficient authorization to retrieve another Organization's record.
These views are available. Complete cross-view correlation is partial because it depends on callers and Runtime instrumentation consistently propagating identifiers.